The Election and The Markets
 Telos Wealth Management Posted on
Sean Gross, CFP®, AIF® | Co-Founder & CEO

The Election
Freedom is the freedom to say that two plus two make four. If that is granted, all else follows. – George Orwell, “1984”
I passionately urge all readers of this letter, who are registered to vote, to proudly exercise your freedom to vote on or before November 8. If you are not registered to vote, please consider becoming registered, so that you can participate in deciding the future of our great country. If you don’t vote, you don’t get to complain!
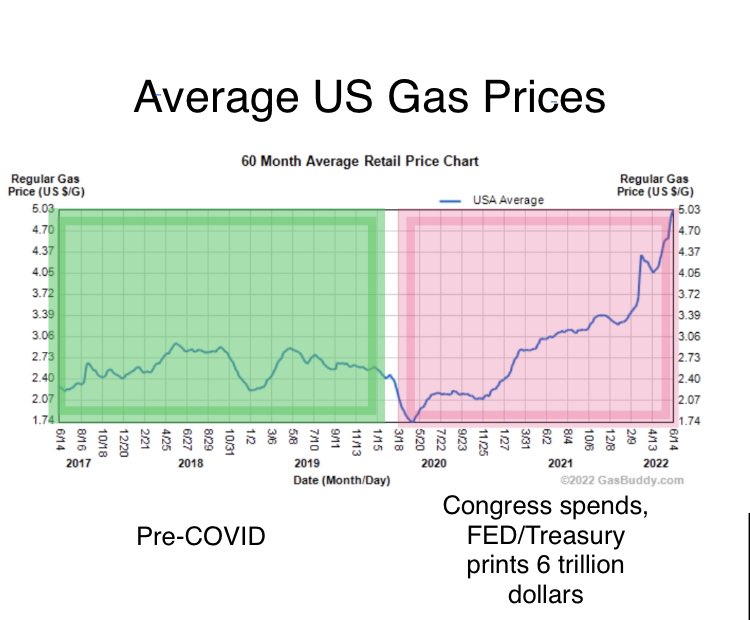
From my perspective, there has never been a more consequential election in U.S. history. Regardless of one’s political leanings, one thing is clear: America is advancing away from constitutional democracy and toward Socialism[i] faster than at any other time in our history. Most glaringly, from an economic perspective, mathematical facts such as two plus two makes four, are increasingly, and recklessly, being disregarded. There is, perhaps, no greater evidence of this madness than the insistence of many U.S. politicians that America can borrow our way to a more profitable future, entirely at tax-payer expense (i.e., at the expense of our children and grandchildren). How long can a household survive when it continually spends more than it takes in?
A recent example of this misguided thinking is the so called “student loan relief plan” which, according to economists Brian Wesbury, Robert Stine, Strider Elass, Andrew Opdyke, and Bryce Gill is expected to add at least $426 billion to the federal deficit.[ii] These same economists note that, with the exception of the COVID years, FY2022 [9/30/21 – 9/30/22] spending as a share of GDP was the highest for any year since World War II[iii]. To make matters worse, all this spending occurred while the economy was expanding, a pattern which violates even the Keynesian economic theory[iv] that government should borrow in periods of economic contraction (i.e., recession) and then pay back the debt during times of economic expansion. Instead, our government has been borrowing record amounts while the economy is expanding. For more than two centuries, America’s consistent fiscal pattern has been to reduce federal debt when the economy is expanding. There has never been this much spending during a time of economic expansion in U.S. history. How are we going to pay back the debt when the economy is in a recession?
If one regards inflation as an evil, then one has to stop inflating. One has to balance the budget of the government.– Ludwig von Mises, “Economic Policy: Thoughts for Today and Tomorrow”
Every American has the right to vote their conscience, without fear of reprisal, being “cancelled”, or being bullied. I am not ashamed to share how I will be voting because I sincerely believe the following issues matter greatly to the survival of our republic, and thus the freedom, success, and prosperity of every American. I am voting for candidates that demonstrate a solid understanding of economic principles and the evil of inflation, are committed to putting America’s economic and security interests first, and pledge to, and have a credible history of, strongly defending freedom of speech and the rule of law.
The Markets
Our Market Environment Indicator (MEI) recently turned positive, resulting in an increase in market exposure and a reduction in cash in our tactical strategies. Strong rallies are quite common in bear markets, so it’s too early to tell if this is a false signal, or if we have entered a new cyclical bull market. For now, we are cautiously overweight risk assets while waiting to see if the bear market is really over, or has further to run. Even if this is only a bear market rally, eventually a rally like this will mark the start of a new cyclical bull market. Trying to predict if this will be a sustainable rally is impossible. Instead, our approach focuses on adjusting portfolio risk exposure based on what the MEI is telling us, versus trying to anticipate what the market is going to do in the future.
We are deeply grateful for the privilege of serving your wealth management needs—it is a stewardship we take most seriously.
[i] Though some prefer the term progressivism for the political movement that views the government as the solution to America’s problems, I believe this is a dangerous canard. Even if one disagrees with this conclusion, history suggests that progressivism leads to socialism and socialism leads to communism.
[ii]Drop in Budget Deficit is a “Sugar High”, https://www.ftportfolios.com/Commentary/EconomicResearch/2022/10/31/drop-in-budget-deficit-is-a-sugar-high
[iii] Ibid
[iv] Keynesian Economics Theory: Definition and How It's Used, https://www.investopedia.com/terms/k/keynesianeconomics.asp
Share Article →